Could Microsoft Copilot Turn Your Excel Spreadsheet into a Live Dashboard?
Microsoft’s newly announced Code tab in Copilot could turn the spreadsheet your team relies on into a dashboard built around the questions they ask every day.
Your team keeps an Excel spreadsheet up to date. But whenever someone wants to know what’s overdue, where a project stands or which orders need attention, someone still has to filter the data and pull together a summary.
Microsoft’s newly announced Code tab in Copilot could give your team another way to use that information: a dashboard built around the questions they ask every day.
What does the Code tab do?
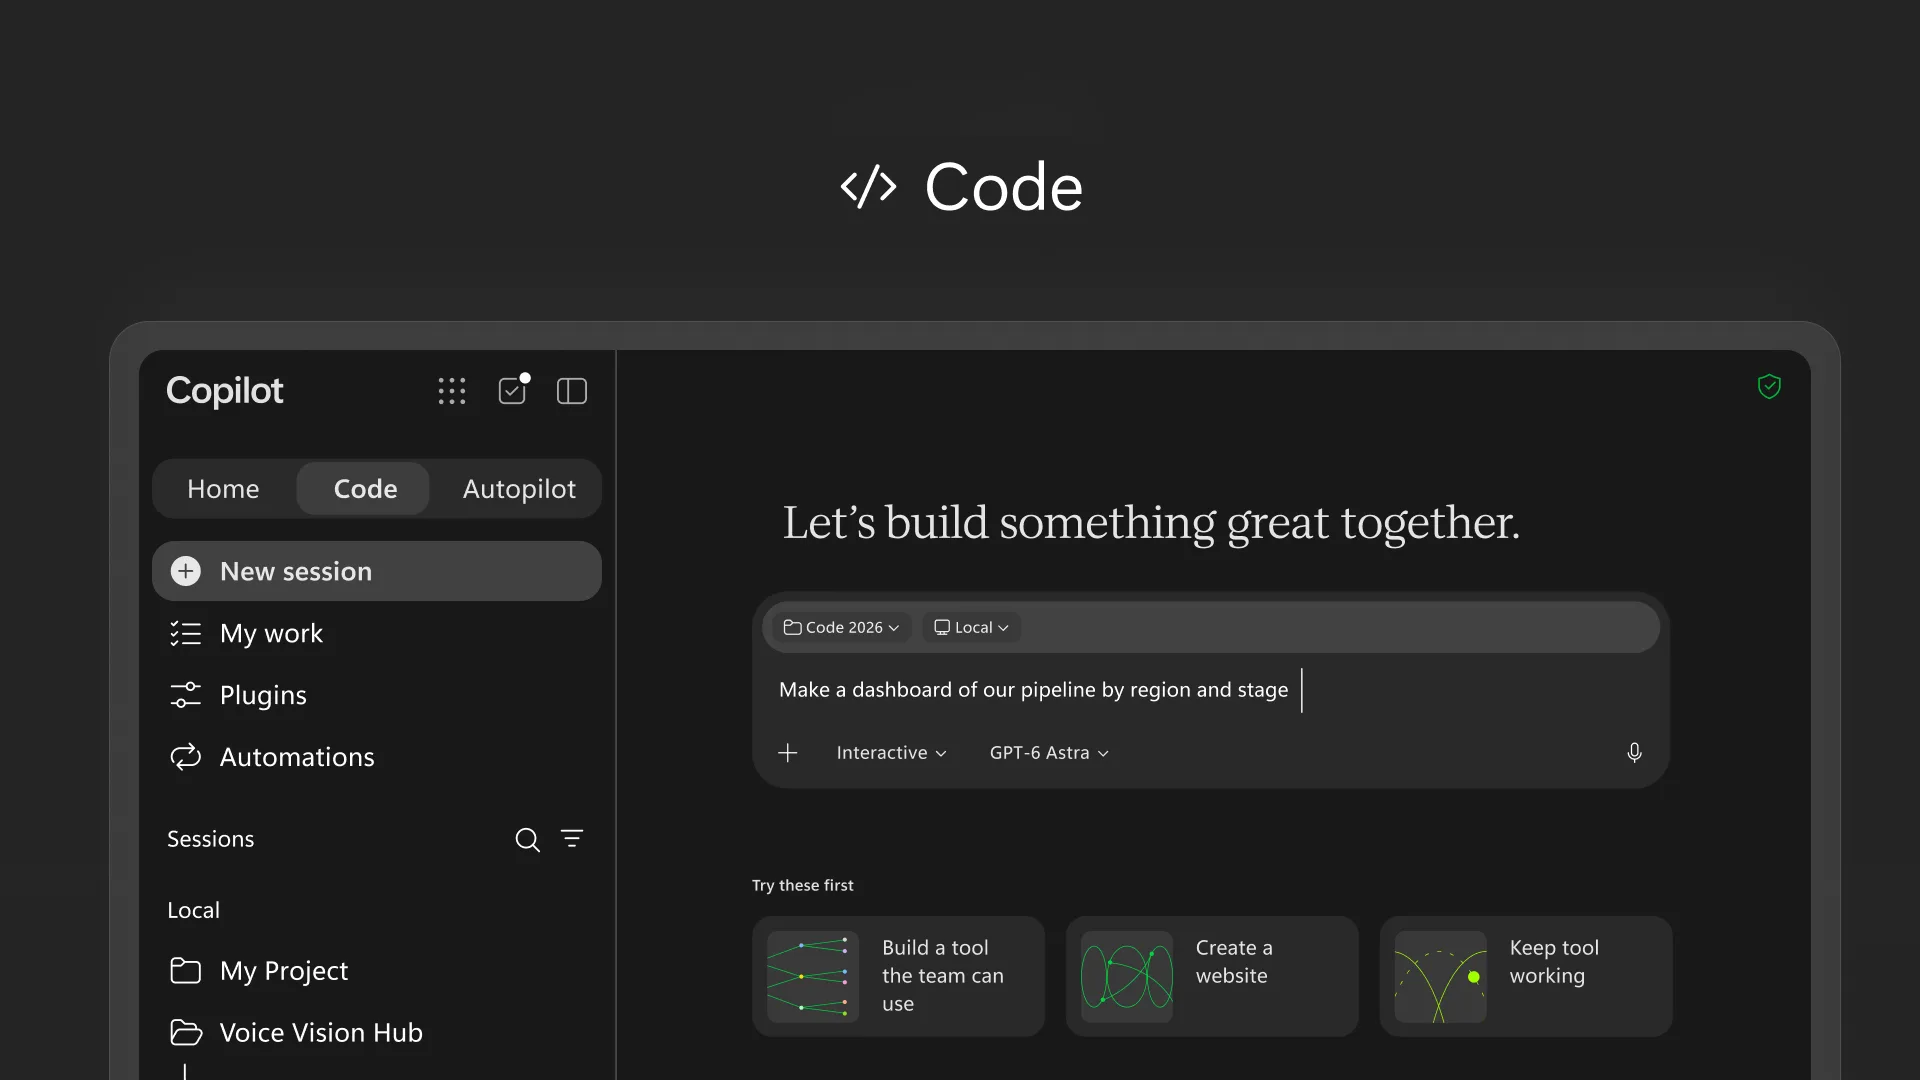
Microsoft says Code lets users describe a dashboard, tracker or internal application in plain language and have Copilot build it. It uses the same underlying technology as GitHub Copilot, with options for hosting solutions within your Microsoft 365 environment.
The announcement places Code’s initial rollout in the Frontier programme, with wider availability to follow. Access will depend on your organisation’s rollout and configuration.
From spreadsheet rows to a useful dashboard
Imagine your operations team maintains a spreadsheet of purchase orders, suppliers, expected delivery dates and order statuses.
An illustrative request could be:
Build a dashboard from this delivery schedule. Show deliveries due this week, overdue orders and orders awaiting confirmation. Let us filter by supplier and open the underlying order details.
Instead of repeatedly preparing a summary, your team could use a shared view designed around those decisions.
The same approach could be explored for project milestones, sales pipelines or outstanding invoices—wherever a spreadsheet holds information people regularly need to interpret.
What makes it “live”?
A dashboard built from an uploaded spreadsheet is only as current as that upload.
For it to stay current, the solution needs a connection to the source data, appropriate permissions and a defined refresh process. Microsoft’s announcement describes support for connecting applications to live data, but the specific Excel connection and refresh behaviour would need to be configured and tested.
That distinction matters. A polished dashboard showing yesterday’s information can still lead to the wrong decision.
Start with the question your team keeps asking
Before building anything, choose one spreadsheet and identify the three questions people regularly ask about it.
For a delivery schedule, those might be:
- What is arriving this week?
- What is late or still unconfirmed?
- Which suppliers need a follow-up?
Build the first version around those questions. Check its totals, filters and dates against the source spreadsheet, and make the last refresh time visible.
A useful dashboard should make the next action easier to identify.
Put Copilot to work in your business
Have a spreadsheet your team relies on but struggles to get useful answers from?
G3 Digital’s Microsoft Copilot Accelerator helps your team identify practical use cases, build reusable workflows and learn to use Copilot effectively. Custom dashboard applications and integrations are scoped separately.
Book a Copilot readiness call to explore what’s possible in your Microsoft 365 environment.
Information checked: 2 October 2026. Dashboard examples are illustrative; feature availability and implementation requirements vary.